There are two tools marketers often use to measure and analyze their site: Google Analytics and Google Search Console. But, what’s the difference between the two? For any online marketing or SEO approach, reading analytics is essential and there are plenty of tools that can improve your campaign.
Let’s look at the features of both of these resources in-depth that will further help you understand each distinction and how to best utilize them onsite. Read our article to uncover helpful information on improving your site.


Google Analytics vs. Google Search Console
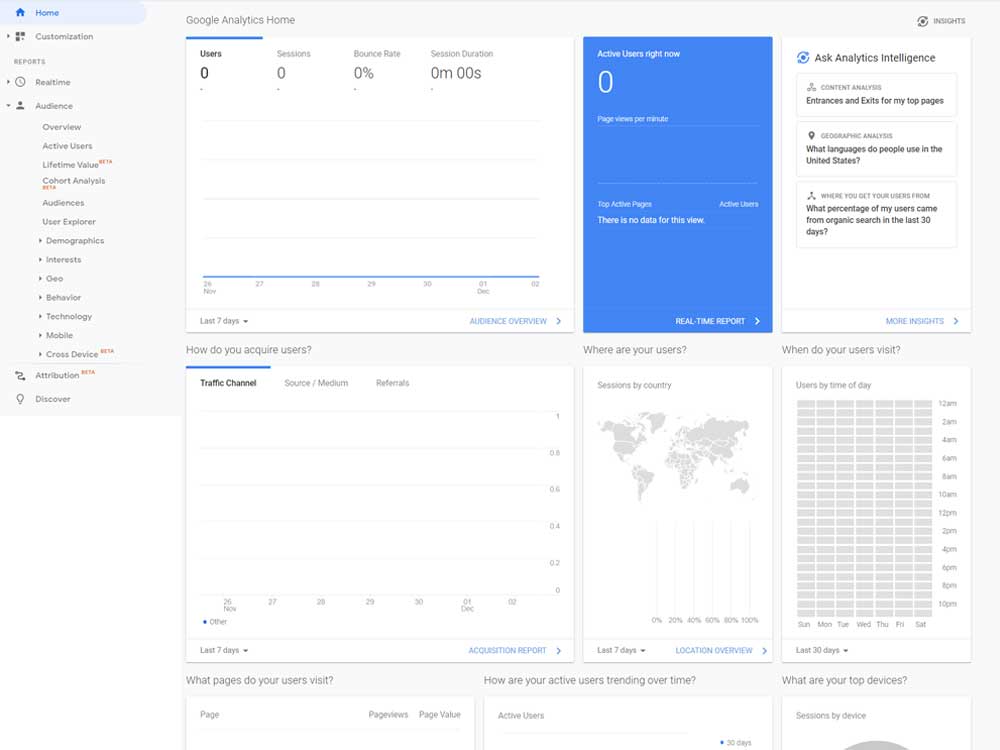
Analytics will provide you data and metrics of your website’s performance such as visitor’s info, bounce rate, and time spent on each webpage. What’s more, it provides statistics on the number of visitors, where they come from, where they found your site, and etc.
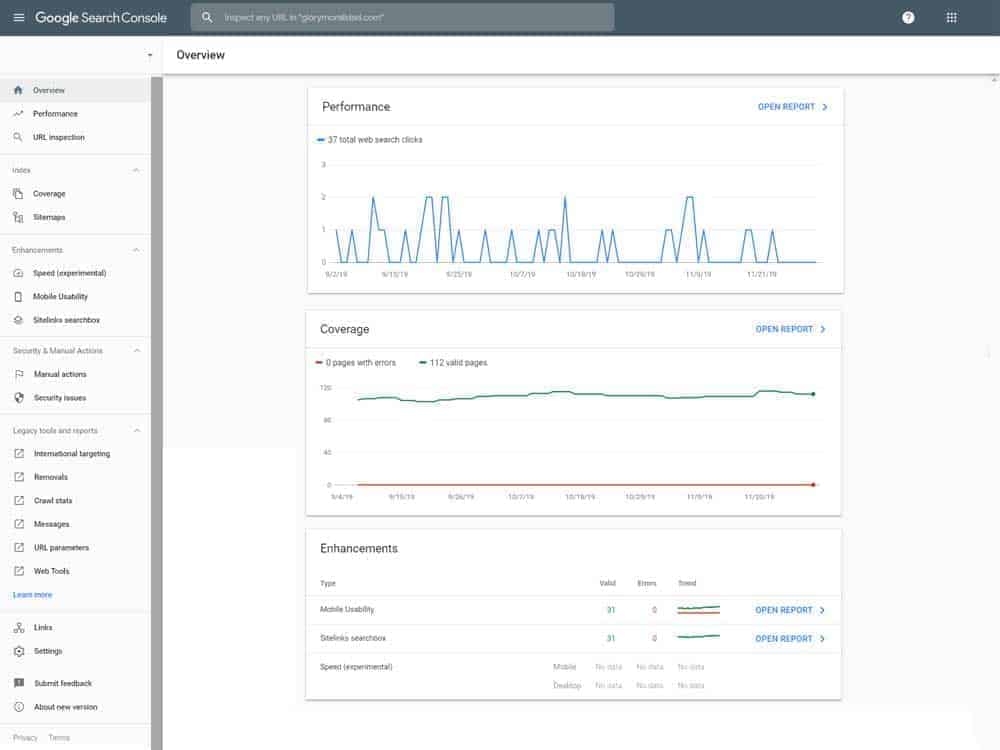
Meanwhile, Console is used to provide information on the indexing status of the website and optimizes its visibility. It helps monitor and troubleshoots your site’s ranking in Google Search results. You can expect info of inbound links or common problems that affect site accessibility, performance, and user experience.
In short, Google Analytics is about your users and their engagement.

Elements on Google Analytics
Google Analytics can be daunting, especially when there are over 10,000 key metrics used for review and evaluation. To a website owner, knowing the basic elements on Google Analytics help you understand your site better. Here are the best ones:
Demographics
The Audience Demographics tab helps you see who’s visiting your site. You can see their age, gender, location, and even their search behavior. You even take a glance at how they search your website such as browser used, technology usage (mobile, desktop, or tablet), and how long they stayed on your site.
Acquisition
This is a more detailed view of where your users come from and how they discovered your site. You can find accounts and summaries of all traffic and sources from campaigns, Google Ads, Social Media, and Search Console.
Users per page and time
You get to know how long users are visiting each page on your site. This metric also helps you understand your visitors are reading, learning, and enjoying the most. Study this metric on how to improve the user’s attention. Avoid having bounce rates on your site and keep page visits to at least two minutes.
Pageviews and landing page
The page views tab helps you keep track of the number of visitors landing on your page. Take note of how many unique views you’ve garnered and where they come from. This will help set your goals and efforts in retaining them to visit your website.
Devices, browser, and OS
Are your customers on mobile? Do you integrate web responsiveness for your website? These insights help you determine which devices, browser, network, operating system, and cross-device channels your users are from. This will help you put into the effort to make your content available on all platforms.
Conversions
The conversions tab is a multipurpose way to measure how well your website is performing. It contains Goals, E-commerce, and Multi-Channel Funnels to learn how your website achieved your goal. Whether that will be a “Thanks for registering!” Page, product sales, billing locations, the tab can better analyze your data to enhance marketing campaigns, purchases, and transactions.

Elements on Google Search Console
Google Search Console shows your website’s performance on the search page. It covers search performance, mobile responsiveness, and index coverage, among many others. In other words, the console addresses your website concerns about how to be “searchable” on search engines.
If Analytics is about your web visitors, then the console is about you. You’ll see various data about your click-through rates, impressions, or average position in search results to improve your website.
Performance
The performance tab allows you to see the total number of clicks, impressions, average CTR, and average position of your website. Here you can see what keywords your users are looking for, that made them land on your website. What’s more, it lets you see which pages are performing best, what countries are visiting your site, devices they used, and the number of search appearance on search engines.
Indexed pages
Indexed pages are webpages that search engines can crawl and rank in Google. However, there may be pages where it can’t be indexed due to some reasons, whether they are intentional or not. You can see them on Google Search Console and make fixes on your part to make your site visible to users.
Sitemap
A sitemap is a website file that allows search engines like Google, know all about the pages your site has for crawling. Here, you get to update, revise, or delete files to tell Google to see what your website is made of. The tab also allows you to see any errors that Google comes across when analyzing your site.
Speed
You can check your site’s speed performance based on real-world usage data. This feature is still experimental and might not show all data. Meanwhile, you can go to Google PageSpeed for insights and analysis of your page speed. You get to see generated suggestions to make your website faster.
Mobile usability
The report shows which pages in your site that have mobile responsiveness issues and how you can fix them. For instance, there are media files that went beyond the frame or there are texts that are too hard to read. The tab has a list of affected pages you can check for fixing.
Conclusion
Now that we’ve covered the basic difference between Google Analytics and Google Search Console, both tools are different, but they can help you achieve proper web traffic on search engines. These resources help you understand how users discover your site, what they do, and how long they stay. Instead of isolating the usage of one tool, you can choose to use both to provide you a wholesome insight into what’s working for your website.


